Donation trends in Japan ④: Donor Attributes (Giving Japan 2015) Reports
Posted on June 07, 2016
by Giving Japan
47.1% of female, 40.3% of male make a donation. More than half of people aged 60 and over make a donation.
In terms of the attributes of individual’s donation, by gender, female make more donations than male, and by age group, the ratio of donors goes up as the age of donors goes up both with male and female. More female make a donation than male at all ages except in their 20’s (Fig. 1-8 and Fig. 1-9).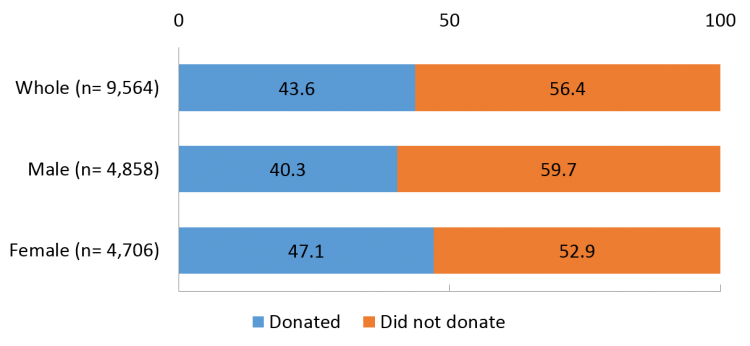 Fig.1-8 Rate of donors by gender
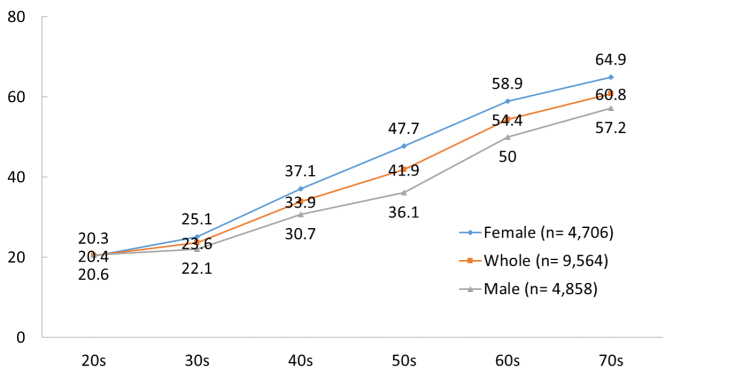 Fig.1-9 Rate of donors by gender and age group
In terms of the ratio of donors in their 30’s to 50s by the number of children who live with the donors, the ratio of donors who live “with a child” is higher. There is an over 10% difference with female in their 30’s and 40’s in particular (Table 1-5).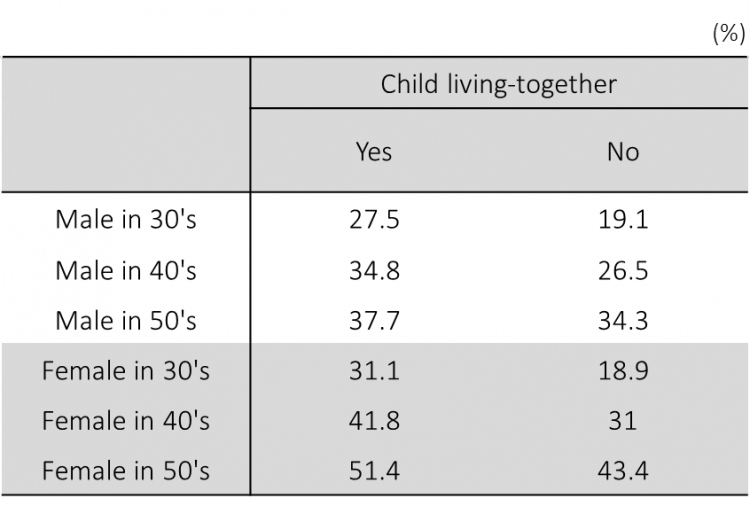 Table1-5 Rate of donors by gender, age group and presence of child living-together
The ratio of donors is higher with female than male, however, when it comes to the amount of a donation, both the average and median are higher with male than female.
The average donation amount goes up as the age of donors goes up from their 20’s to 50’s, and the highest is donors in their 50’s. On the other hand, when the median is compared, the amount goes up as the age goes up, and donors aged 70 and above is the highest (Table 1-6).
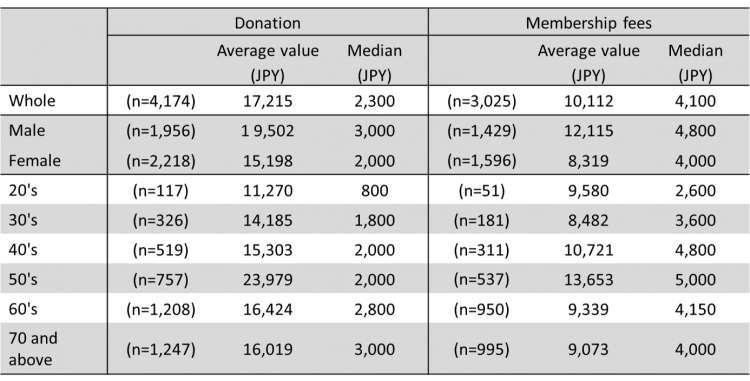 Table 1-6 The average expenditures of donation and membership fees
In terms of household income, those with annual income of less than ¥1 million marks over 10% lower than the whole group, and those with annual income of ¥14 million or more marks over 10% higher than the whole group (Fig. 1-10).
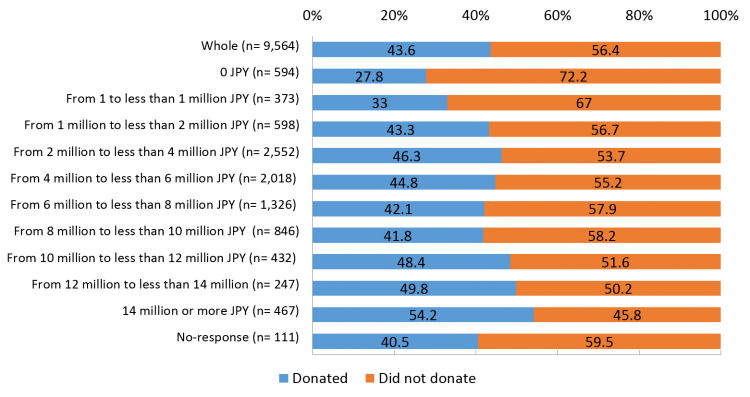 Fig.1-10 Rate of donors by household income
Table of Contents
- Index
- 43.6% of people donated money and 24.6% of people donated goods. More than half make a donation a year.
- Four years from the Fukushima earthquake disaster – Donors remains as 40% and the total amount of donations was increased to ¥740,900 million.
- 47.1% of female, 40.3% of male make a donation. More than half of people aged 60 and over make a donation.
- Online donation increases slightly. “Hometown tax donation” and “Gifts with donation” are expected to see a future increase as more people showed an interest.
- “Sympathy to organization” and “Social contribution awareness” are particularly high with donors who make a donation of ¥50,000 or more.
- Important criteria for donors to consider when making a donation – “the use of monetary donation,” “the meaning/purpose of the activity,” etc. ranked high. Those two are viewed more important by donors who have an organization that they wish to support than those who don’t.
- Corporate donation is ¥698,600 million (2013 fiscal year) and 16.2% of all the corporations has reported as donation expenditures.
- Donations are certainly gaining its momentum.
Recent Articles
- Towards a society where children want to embrace life
- The Evolution of Philanthropy: Five approaches shaping contemporary practice
- 25 years of community understanding and moms’ hard work: The activities of Kinutama Play Village
- Connecting memories: Courage found at the film screening of parents’ legal battle after the Great East Japan Earthquake Tsunami
- An NPO project I came across while reflecting on teacher shortages after leaving my teaching job
- To unlock philanthropy’s potential for Japan, we need to understand its meaning